

VIX as an SPY indicator


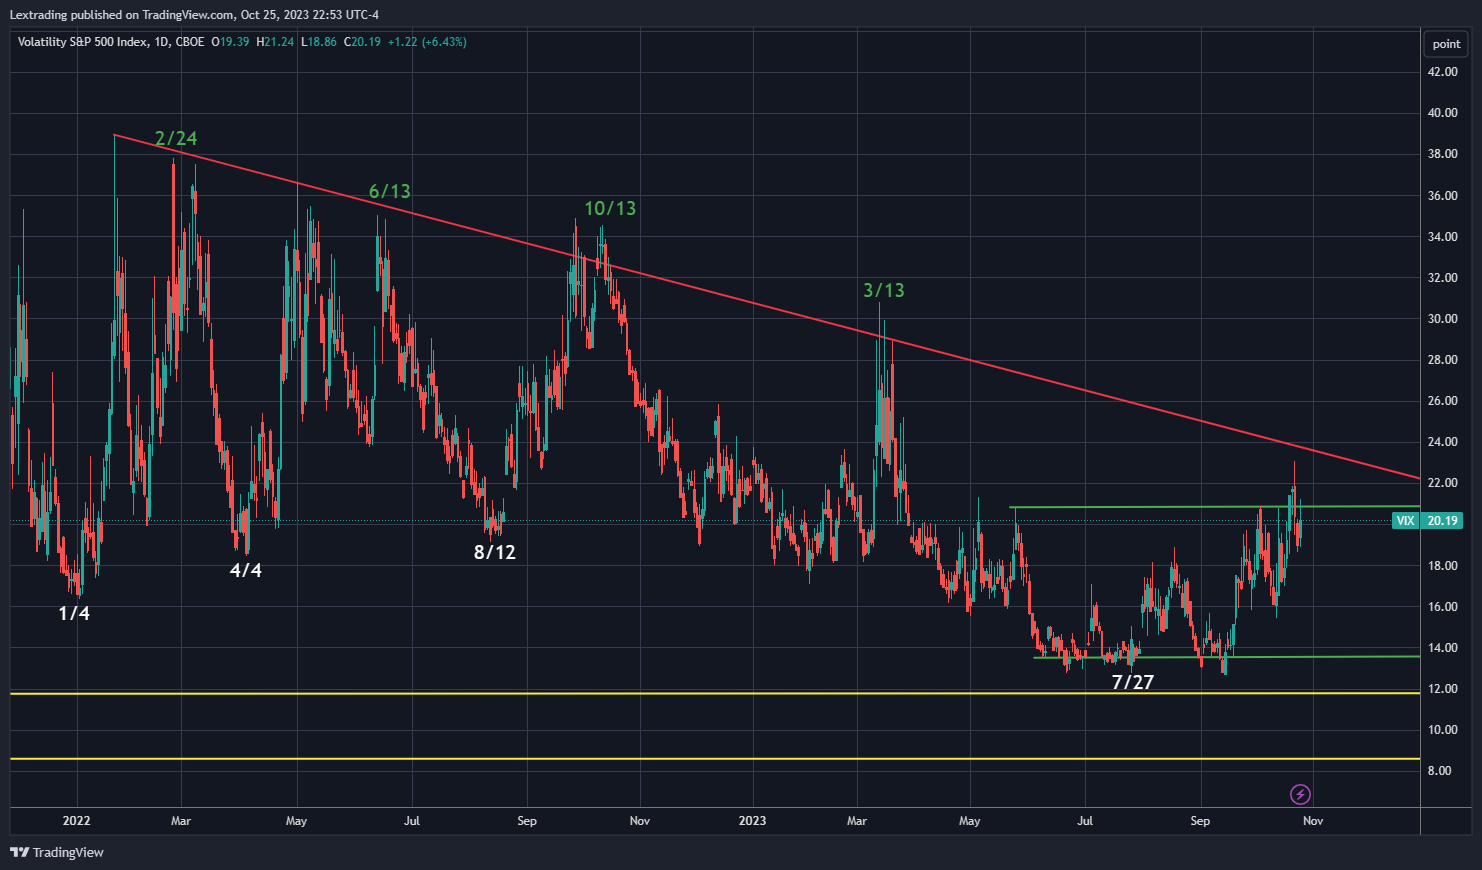
The VIX is a powerful indicator in determining the direction of the market. During the October 2023 lows, I shared the chart below showing the relationship between SPY and the VIX are inversely proportional. Whenever the VIX is trading at the bottom, the SPY is trading at its peak, and vice versa.
VIX chart from October
SPY inversing VIX

VIX chart TODAY
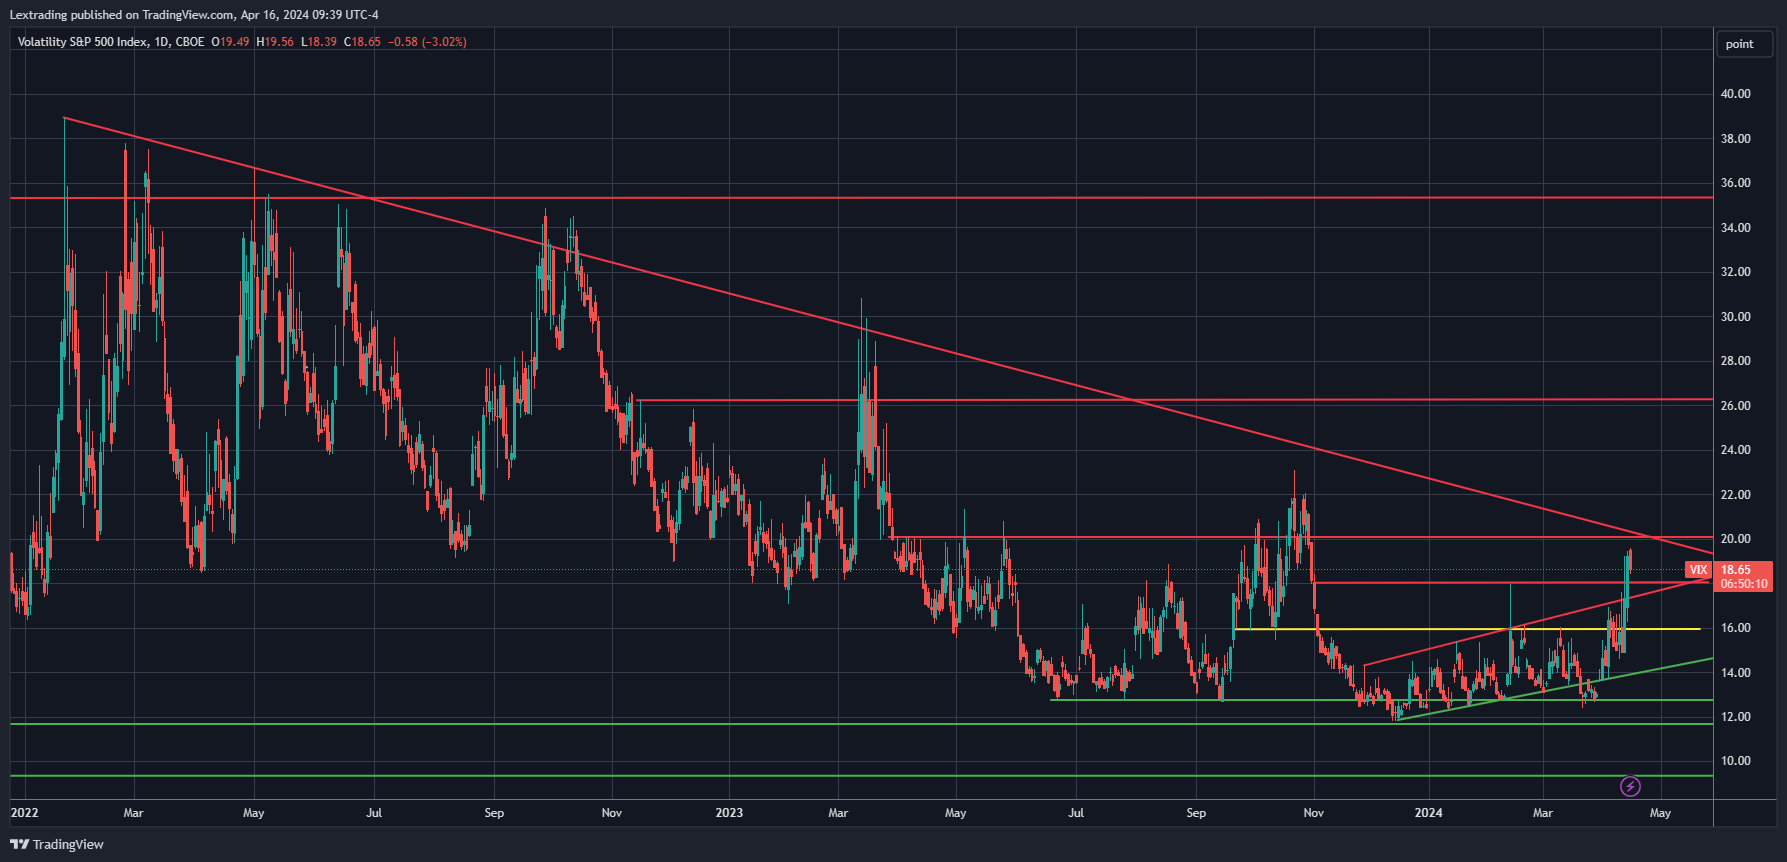
Notice the strength of the resistance from January 2022. This is why I am paying extra attention to the VIX these days as it trades near the resistance. Its collapse here will likely set off the next rally.
Below, I set a filter for all options >$500k to see where the whales are betting on the VIX. I think the strike price is telling on where the top might be for this volatility spike and the potential reversal date.